Aug
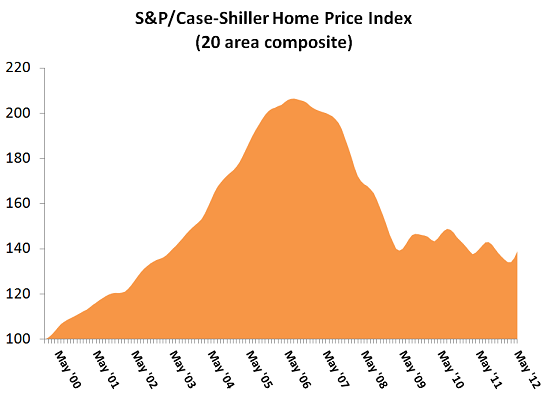
The S&P/Case-Shiller home price index figures came out this week. On the whole, the national home price index was up 2.2 percent over the prior month (seasonally adjusted basis) and increased 0.7 percent over the prior year. For the first time since the onset of the recession, home prices in all 20 covered statistical areas increased over the prior month. Additionally, on a year over year basis, 12 of the 20 areas are now above water.
The largest gainers for the month of May included:
- The Chicago-Joliet-Naperville Illinois, Indiana, and Wisconsin areas, which increased around 4.5 percent;
- The Atlanta-Sandy Springs-Marietta Georgia area, which increased around 4.0 percent;
- The San Francisco-Oakland-Fremont California areas, posting a 3.9 percent gain;
- The Minneapolis-St. Paul-Bloomington, Minnesota and Wisconsin areas, increasing 3.1 percent; and
- The Phoenix-Vancouver-Hillsboro, Oregon, Washington areas, notching a 2.7 percent increase.
On the slower end, the areas experiencing the least increase in home price appreciation included:
- Detroit-Warren-Livonia Michigan areas, increasing 0.4 percent;
- The San Diego-Carlsbad-San Marcos, California areas, up 0.9 percent;
- The Charlotte-Gastonia-Rock Hill North Carolina and South Carolina areas, posting increases of 1.0 percent;
- The New York-Northern New Jersey-Long Shore, New York, New Jersey, and Pennsylvania areas, increasing 1.4 percent; and
- The Miami-Fort Lauderdale-Pompano Beach Florida area, increasing 1.4 percent.
Of the top five performing housing markets for the month, two are among the worst performing on a year to date basis, two are among the best performing, and one is in the mediocre area of year over year returns.
On a year over year basis, the areas up the most include:
- The Phoenix-Mesa-Glendale Arizona areas, up 11.5 percent;
- The Minneapolis-St. Paul-Bloomington Minnesota and Wisconsin areas, increasing 5 percent;
- The Dallas-Fort Worth-Arlington Texas areas, posting a 3.8 percent gain;
- The Denver-Aurora-Broomfield Colorado areas, up 3.7 percent; and
- The Miami-Fort Lauderdale-Pompano Beach Florida areas, increasing 3.4 percent.
Eight of the areas are still below water on a year over year basis:
- The Atlanta-Sandy Springs-Marietta Georgia areas, down 14.5 percent;
- The Las Vegas-Paradise Nevada areas, down 3.2 percent;
- The Chicago-Joliet-Naperville Illinois, Indiana, and Wisconsin areas, down 3.0 percent;
- The New York-Northern New Jersey-Long Island, New York, New Jersey, and Pennsylvania areas, down 2.8 percent;
- The Los Angeles-Long Beach-Santa Ana California areas, down 2.0 percent; and
- The Boston-Cambridge-Quincy Masaschusets areas, down 0.1 percent; and
- The Cleveland-Elyria-Mentor Ohio areas, down 0.1 percent.
With this overall good news on the housing front, one has to wonder how strong and for how long the housing market can continue to be a support to the overall economy. In other words, is this month’s housing price index number a sign of prolonged strength, or is the housing market still weak and therefore subject to the fault lines of the economy? It’s a tough question when one looks at the history of the S&P/Case-Shiller Index, where the upticks of 2012 appear to be more noise in a downward trend. Although this view may end up being correct, it appears most professional forecasters generally consider the housing market to have bottomed out. Of course, that doesn’t mean we’ll see the gains of the 2000’s, but single digit gains in an asset class that has declined on average 35 percent over the past few years is nothing to complain about.
Facebook comments:
Powered by Facebook Comments


