Sep
It is starting to look more and more like the housing market is bottoming in many areas. As part of our continuous tracking of the housing and mortgage market, we look at three important measures of the health of a given area’s real estate market
- the %age of loans in foreclosure according to inventory at the end of the quarter,
- the %age of loans in a given quarter that started the foreclosure process,
- and %age loans that are seriously delinquent.
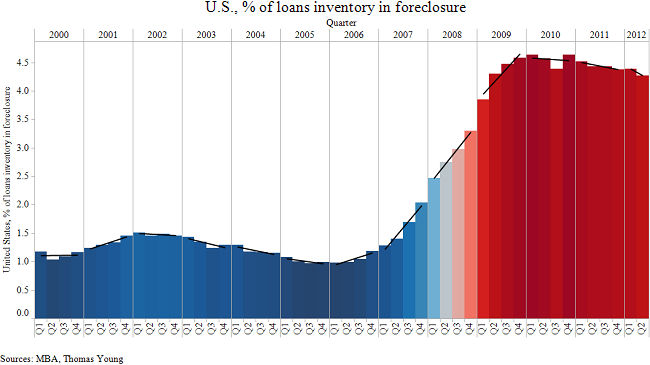
The first measure – percent of loans in foreclosure according to inventory – measures the stock of homes in foreclosure. This measure began increasing in 2006, after which it steadily deteriorated through 2009. Since then, the measure has gradually improved, with the pace of improvement picking up so far through 2012, with the percent of loans in foreclosure now at 4.27%, a 3.6% improvement from the 4.43% seen in the second quarter of 2011.
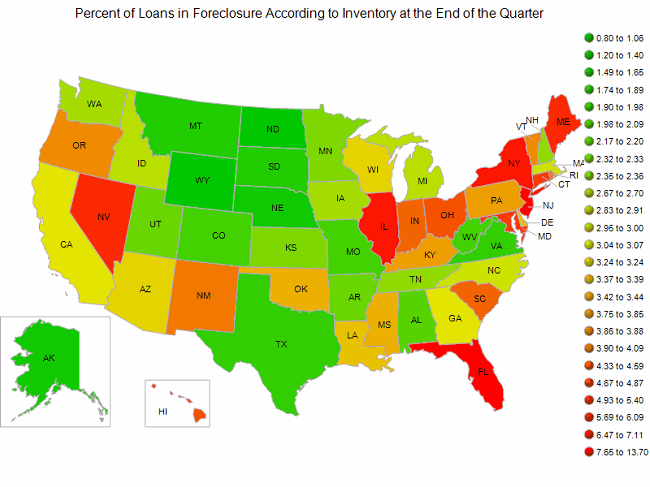
Looking at the measure on a geographic basis, the most recent figures indicate that
- things are the worst in Florida, New Jersey, Illinois, New York, and Nevada.
- In contrast, conditions are best, at least as measured by percent of loans in foreclosure according to inventory, in Wyoming, North Dakota, Alaska, Nebraska, and South Dakota. These states generally avoided the artificial home price appreciation problems because of a continually strong natural resource economy (oil and gas extraction, among others).
- When looking at the largest states by population, California is about in the middle of the pack but quickly improving, while Texas continues to exhibit strong real estate market characteristics.
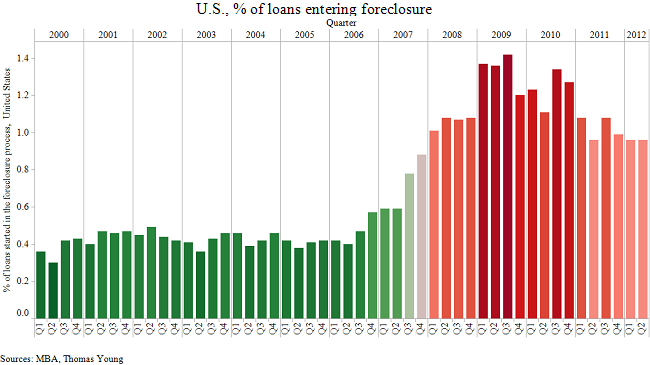
The second measure – percent of loans that started the foreclosure process – measures the flow of homes entering the stock of homes in the foreclosure process. Perhaps not surprisingly, this measure is giving a stronger indication of an improving real estate market than the percent of loans already in the foreclosure process. Overall, the percent of homes entering the foreclosure process in the most recent quarter stayed below 1% for the third consecutive quarter at 0.96%. The measure is now below the levels seen in 2008.
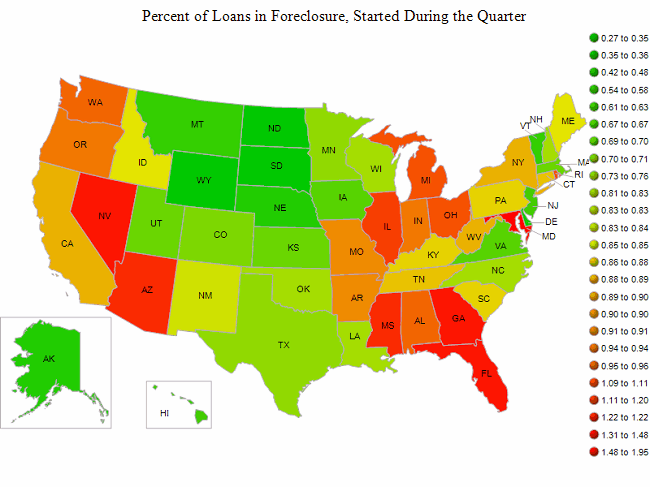
On a geographic basis –
- North Dakota, South Dakota, Wyoming, Delaware, and Alaska represent the states with the lowest percentage of homes entering the foreclosure process,
- while Maryland, Georgia, Florida, Nevada, and Mississippi represent the states with the highest percentage of homes entering the foreclosure process.
- The two largest states – California and Texas – are generally in the middle of the pack, with Texas at 18th best and California at 32nd best. Both states are better than the national average of 0.96% (the U.S. average is not ranked 25th because of certain states bringing the average down much more than other states).
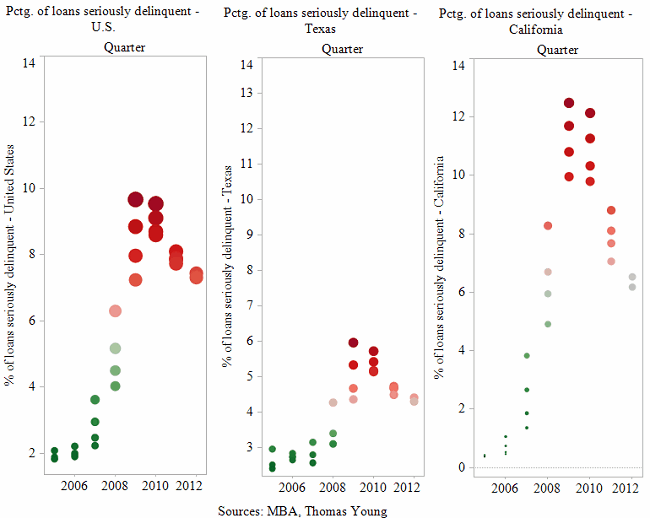
The third measure – percent of loans that are seriously delinquent – measures the group of home loans that have a high probability of entering the foreclosure process.
- On the whole, the measure continues to improve, with the most recent reading at 7.31%.
- The measure varies widely across states, with the two largest states representing a moderate case in point; California currently stands at 6.18%, while Texas’ most recent reading is 4.31%. The difference between the two is about 35% on an average difference basis.
- The overall two percentage point difference represents a narrowing of the difference, as is shown in the following three charts, with the narrowing largely the result of a quickly improving California situation and less quickly improving conditions in Texas (Texas never reached the delinquency rates seen in California, so there was no way or “need” for Texas to improve as quickly as California).
Overall, as measured by the commonly used measures of foreclosure risks and conditions, the real estate markets appear to have bottomed out, with steady improvement the most likely scenario for the coming years.
Facebook comments:
Powered by Facebook Comments


